Read Education Data Done Right Volume II now
Civilytics’ origin is in education data analysis and, though it makes up a significant share of our work, it’s often work that we can be less public about. So this month we’re excited to devote the newsletter to our education work!
In this edition you’ll find:
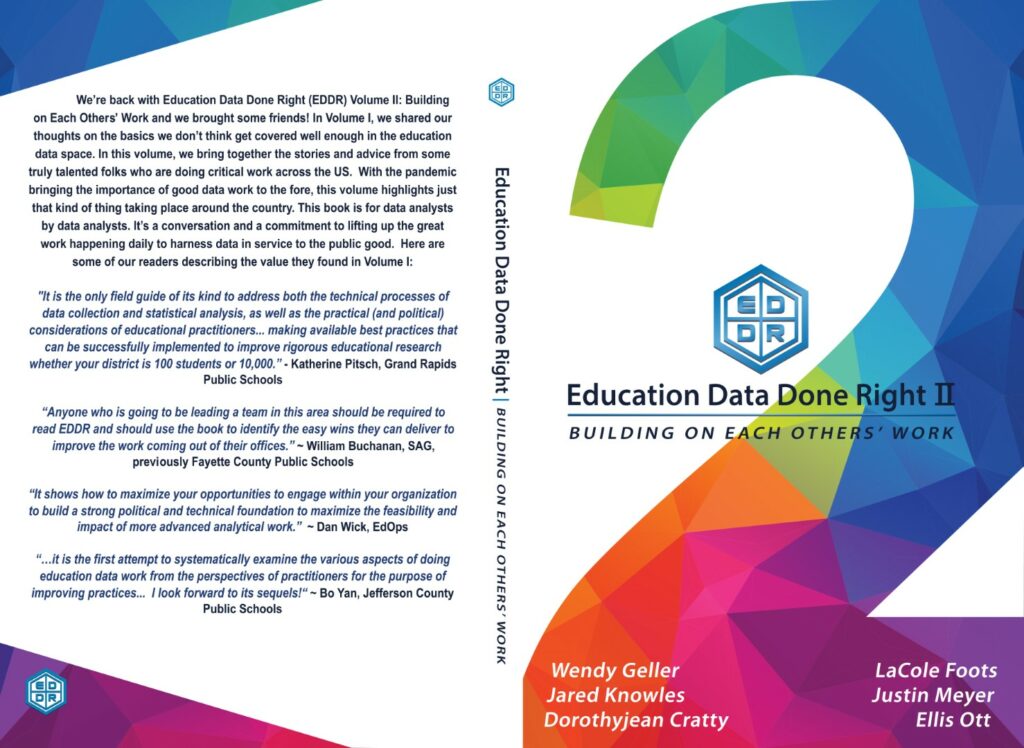
- Announcing our new book — EDDR Volume II: Building on Each Others’ Work!
- A preview of the chapters I contributed on data governance and early warning systems
- Updates on our other education work at Civilytics
As always, thank you for reading. On to the topics.
Announcing EDDR Volume II – Available Now

First up, Education Data Done Right (EDDR) Volume II is now available for purchase! Read on to find out while you’ll want to pick up a copy.
For this volume, I teamed up with 5 data analysts with expertise in public education agencies across the country to write a second volume for the Education Data Done Right (EDDR) series! The book is available now and we need your help spreading the word!
The EDDR series is intended for education agency data analysts, as well as data managers, strategists, and leaders seeking to improve how their agency operates. Many agency analysts come from a social science research background and the transition to work inside agencies can come with a lot of new challenges. The series is a guide through those challenges. It is a book by agency data analysts for agency data analysts.
Behind the scenes, I can tell you that all of the authors have worked hard to bring this book to press from our initial project kick-off in late 2019. It took many late nights, even more apologies for delays, and a lot of decisions to get our DIY book written, designed, laid out, and listed online. I’m really grateful to the team and proud to be able to share their wisdom with the world.
The new volume was written by Dorothyjean Cratty, LaCole Foots, Wendy Geller, Justin Meyer, Ellis Ott, and me. New chapters explain how to document work to ensure continuity of operation and transparency of agencies’ important work; how early warning systems can be useful in agencies’ work; why self-awareness of how identities shape the work is one of the most important skills data analysts must have; and much more.
We’d love to have your support! You can order a print copy, Kindle version, or a DRM free epub here:
https://www.eddatadoneright.com/
The suggested price is $18 but you can always get the PDF version for “pay-what-you-can” via LeanPub.
If you find the book useful you can support the series in a number of ways:
- Share the book with your colleagues
- Write a review on Amazon for any book in the series
- Send us a testimonial to include on the LeanPub page or book homepage
My Chapters in EDDR Volume II
I contributed two chapters to this edition — one co-authored with Wendy Geller about data governance and another about early warning systems.
Data Governance
One of the questions I get asked the most is about what agencies and analysts should be doing to improve their data governance. In Chapter 5, Wendy and I define data governance as the set of policies, rules, and practices that determine how data are collected, stored, accessed, and used inside of an organization.
The key takeaway: Data governance isn’t a project to be completed. It’s an ongoing organization-wide duty.
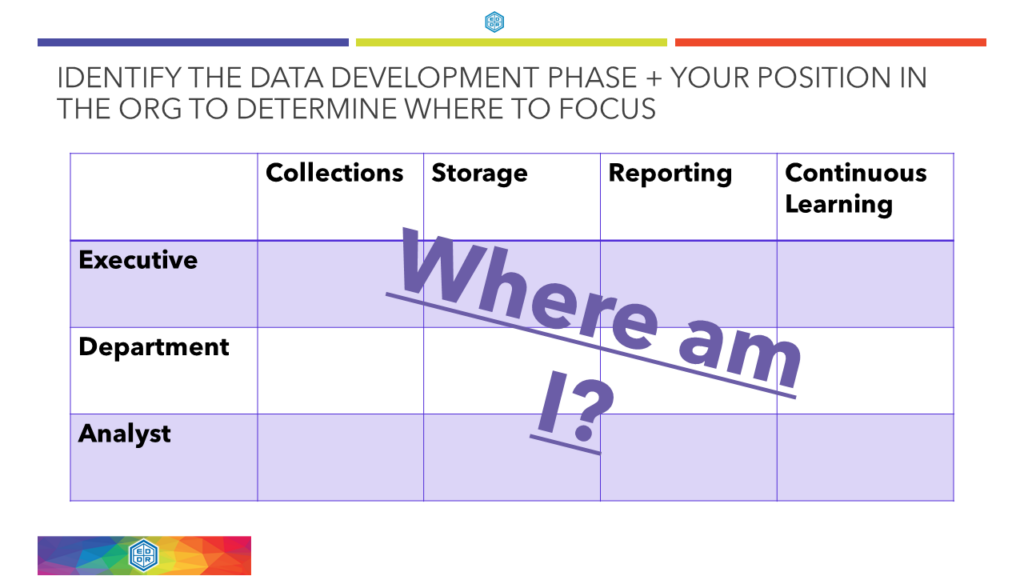
It can be daunting to know where to get started with data governance, or what data governance tasks should be done first and by whom. To orient yourself to different governance challenges and identify the questions to focus on for each, one strategy we suggest is crossing your position in the organization with the development phase of the data system(s) you’re working on.

Once you “locate yourself” by development phase and position, Wendy and I provide a checklist with specific questions to ask. We also examine a few different angles leaders can take to evaluate their organizational needs and identify which data governance tasks are most urgent.
I got my start in data governance work as the Pupil Data Privacy Officer on a Statewide Longitudinal Data System (SLDS) grant. Every time I heard or talked about “data governance” in our project meetings, it felt smushy and vague. The strategies in this chapter are intended to help make your data governance tasks tangible and actionable while building a data culture.
Early Warning Systems
In chapter 6, I provide a practical guide to Early Warning Systems (EWS). I’m probably best known in education research for the Wisconsin Dropout Early Warning System and the detailed step-by-step technical guide to its implementation that I published in the Journal of Education Data Mining. This chapter covers what I have come to realize are the much more important aspects of any education analytic project — the steps in the stakeholder design process.
There are a lot of EWSs and other predictive analytics being built in education agencies and sold by vendors — but many of these projects fail to have an impact because they were not developed through a process that engaged and gave voice to stakeholders. The chapter shows why stakeholder feedback is critical to success and gives a roadmap from design to rollout and maintenance for a successful system.

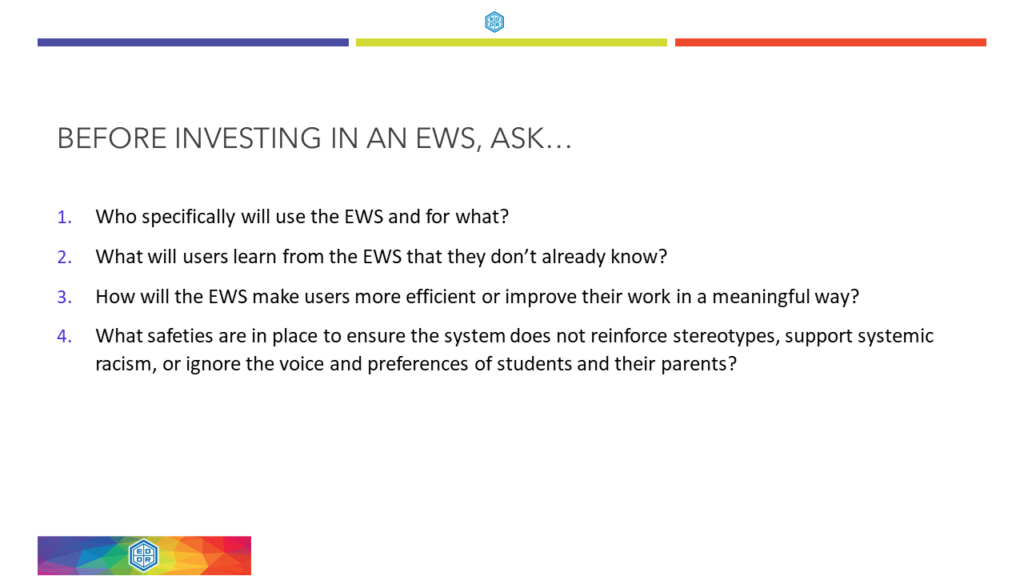
The guide starts with questions to assess whether or not your agency actually needs and will benefit from an EWS. It next discusses the people, data, and support systems you need to have in place (or obtain) to capture the value of the EWS. Then, I give a consumer perspective to the major design elements of an EWS, focusing on how to know what’s important and what’s not in the technical design. I offer key questions to ask about each of the design elements (e.g., outcome, predictors, pre-processing, model training). Next, the guide provides a variety of suggestions about how to pilot and rollout an EWS successfully, finally concluding with important notes on ongoing maintenance and improvements you will need to invest in to keep deriving value from the system.
If you are starting to build a prediction system of any kind – but especially predicting student data – this chapter captures the best advice I have. In particular, the chapter talks a lot about opening up design decisions to a broader audience in order to build a system in a technically sound way that is also accountable and applied equitably.

PS. When I was prototyping the Wisconsin Dropout Early Warning System (DEWS), I thought the magic was in my machine learning approach. But as we moved forward from the prototype to production, my colleagues showed me that the real magic would come if we developed the system through a process that was transparent, built trust, and gave educators a voice in design decisions. The reason – only then would the system be used and have an impact. It worked! Here’s me receiving a government innovation award for DEWS. I was very happy…but should have fixed my nametag!
Updates on Our Other Education Work
It hasn’t all been trying to push this book over the finish line! In the last month or so, we’ve also:
- Added another What Works Clearinghouse (WWC) certification to our capabilities when Hannah completed the single-case design WWC certification. If you need a thorough, fast, and skilled reviewer for systematic reviews, let us know!
- Presented at an advisory board meeting for the Urban Institute Education Data Portal on known data errors in the Civil Rights Data Collection and their impact on equity analyses
- Presented about the barriers and benefits to establishing informal open-source collaborations around education analytics to the Student Leadership Network
- Wendy Geller and I gave a book talk on EDDR Volume 1 to Stanford’s Education Data Science Masters students and fielded a lot of great questions from future education data analysts.
No link roundup this edition — consider giving EDDR a read!
As always, we appreciate your help spreading the word about this newsletter. If you haven’t already, please subscribe. If you subscribe, send it to a friend, or share it on social media.
And, we love to hear from you! If you’ve got a project you think Civilytics can help with or a question, do get in touch.
With gratitude,
Jared

