Here at Civilytics we sunk way more time into understanding ARPA aid allocations than we initially expected to. The more we learned, the more we wanted to know – and we got a little obsessed. We justify this to ourselves and to you by reiterating that this is $19.53 billion, affecting 27,000+ local governments across the country, and at least 100 million people.
We think understanding the data and methods we used – and how you can reproduce them yourself – may be of interest to other data analysts, open government advocates, and more. So here goes:
- 1. Why isn’t calculating aid allocations easy?
- 2. Ok, you can’t just look up the allocations so what do you do first?
- 3. Now I’m curious what the allocations would look like under an equal aid approach. How can I figure that out?
- 4. So why are small towns in some states getting $104 per person and those in other states getting $1000 per resident?
- 5. How does using the “non-metro population” lead to this distortion?
- 6. Wait, what’s an unincorporated place?
- 7. So what would you like to see happen?
- 8. Why does Civilytics care?
- 9. Are you anti-ARPA or anti-State and Local Fiscal Recovery Funds?
- 10. Why are you the only ones who did this analysis?
1. Why isn’t calculating aid allocations easy?
Treasury didn’t publish ARPA aid allocations (or aid estimates) for smaller cities, towns, and villages — called “non-entitlement units” or NEUs under the law. We hope they will but that’s another story. For now, Treasury published a PDF with the aggregate allocations to states for distribution to NEUs and an Excel file with 59 tabs providing a list of local governments and their respective (nonexclusive) populations.
2. Ok, you can’t just look up the allocations so what do you do first?
For 42 states, it’s straightforward. You go to the correct state tab in the spreadsheet and sum the column with the 2019 population estimate. Then you take the state allocation from the PDF, divide it by the summed population, and get the per resident allocation for that state. (You can, of course, then multiply that by any listed NEU’s population to get the estimated aid for that city, town, or village – but, again, that’s a little beside the point.) What you will quickly notice is that many states have per resident allocations around $100 while others have allocations up to $1000 per resident (or more). If you are us, you will wonder why this is.

Complication 1: What about those other 8 states?
According to Treasury, these eight states have “minor civil divisions that typically perform less of a governmental role.” Treasury provides rules about how states should determine whether or not their minor civil divisions (MCDs) are eligible for the aid. In the meantime, we don’t know what the eligible NEU population is (and neither does Treasury).*
For these states, Treasury’s spreadsheet has two tabs: one with MCDs and one without.
We can think of the population excluding MCDs as likely a lower bound. For example, Illinois’ summed NEU population on the tab excluding MCDs is 5,459,441 people. We would hope that the tab that includes MCDs would provide a corresponding upper bound. Unfortunately, data do not care about hopes.
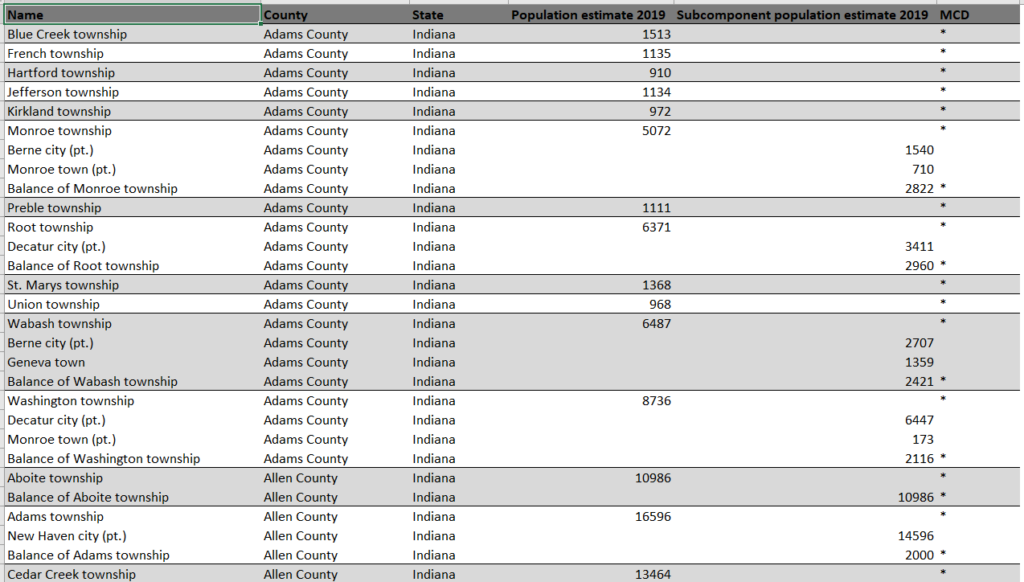
If we sum the NEU population estimate on that tab for Illinois, we get 11,229,950 people. But we know only 12.6 million people live in Illinois, and more than 2 million of them live in Chicago. So 11.2 million is too high to be the upper bound for Illinois’ NEU population. The problem is we can’t tell what the correct upper bound is because Treasury’s spreadsheet doesn’t include unduplicated populations. In fact, the tab just uses color coding to show different possible combinations of sub-populations. Different city sub-populations can appear multiple places on the spreadsheet – check out “Abingdon city” for example or Monroe township below.

So the best we can hope for these states is to get a range of population estimates and corresponding allocation amounts.
Complication 2: Doesn’t ARPA restrict NEU funding to 75% of the NEU’s annual budget?
Yes, it does but NEUs’ budgets are not available to us or to Treasury, so we cannot account for this regulation in our analysis. We expect the 75% cap to primarily affect the smallest towns in the states with the highest per capita allocations. For example, not all NEUs in Nevada may receive $1300 per resident. However, to return to some of our examples: Azusa, CA, will still receive twice as much per resident as Milford, CT, despite having fewer residents, and the wealthy DC suburb of Vienna, VA, will still receive over $1k per resident. These cities’ annual budgets all far exceed their ARPA allocations and are not affected by the cap (see older budgets for them here: Azusa, Milford, Vienna). Also, even if some towns exceed the cap, the money is returned to Treasury, not redistributed across states to remaining NEUs to address the disparity.
The bottom line is that: (1) Without looking up each NEU’s budget, we can’t adjust our analysis for this regulation and (2) While this will likely attenuate the greatest disparities, large disparities affecting thousands of NEUs, millions of people, and at least a couple billion dollars will still remain.
3. Now I’m curious what the allocations would look like under an equal aid approach. How can I figure that out?
Sum the NEU populations for each state, which you got earlier using Treasury’s spreadsheet. (As a reminder, for the 8 states with MCDs, you’ll have two different population estimates.) Take the total aid allocated to this program ($19.53B) and subtract the aid for Hawaii and U.S. territories since they do not have any NEUs listed in the spreadsheet Treasury provided. (Lacking other information, we assume their aid is fixed.) That leaves $19,319,674,715 to allocate among states. Divide that by the population estimates to get an estimate of the amount per resident under an equal allocation approach.
Our calculations indicate that, under an equal approach, every small city and town would receive between $166 and $193 per person. Using the population that excludes MCDs (100,296,504) results in a higher amount – by definition, it’s fewer people to divide the funds among.†
4. So why are small towns in some states getting $104 per person and those in other states getting $1000 per resident?
To get to the bottom of that, we have to understand how the law directed Treasury to determine the state allocations. The original text of the bill that became the America Rescue Plan Act (H.R. 1319) stated that NEU aid to states should be distributed based on the NEU population:
“B) Allocation and Payment. From the amount reserved under subparagraph (A), the Secretary shall allocate and pay to each State an amount which bears the same proportion to such reserved amount as the total population of all nonentitlement units of local government in the State bears to the total population of all nonentitlement units of local government in all such States.”
H.R. 1319 Sec 602 (2) (B) (emphasis added by author)
But, in the final law, the language for the same section was changed:
“(B) Allocation and Payment. From the amount reserved under subparagraph (A), the Secretary shall allocate and pay to each State an amount which bears the same proportion to such reserved amount as the total population of all areas that are non-metropolitan cities in the Statebears to the total population of all areas that are non-metropolitan cities in all such States.”
Public Law 117-2, cited by Treasury, (emphasis added by author)
The distortion in the amount of funding per NEU resident arises from this change.
So what is the “total population of all areas that are non-metropolitan cities” nationally and in each state? Buckle your seatbelts because this is where it really gets tedious.
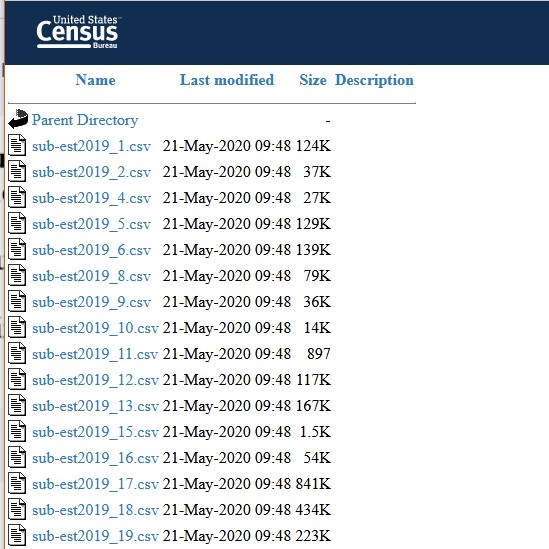
Unfortunately, Treasury chose not to publish this information directly. Instead they note in several places (e.g., here) that they’re using the 2019 population estimates and include a footnote (footnote 3) in one PDF pointing to a CSV file with the populations by city, NEU, and state. Make sure to scroll over to column V for the 2019 estimate! If you don’t want the data for all 50 states in one file, you can use this vintage site to look up each state.

The file doesn’t have a unique identifier (!!) and doesn’t identify which are the metro cities vs. NEUs, so now you’re going to need to match the list of metropolitan cities Treasury identified to the populations from this file mostly by hand. (We did try some automated name matching, but given the high stakes we couldn’t be confident enough in the accuracy – even 1 mismatch could distort the estimates for every state. So, we sorted alphabetically and typed in by hand –a painstaking approach for 2021 but one that necessitated by the limits of the data Treasury chose to provide.)
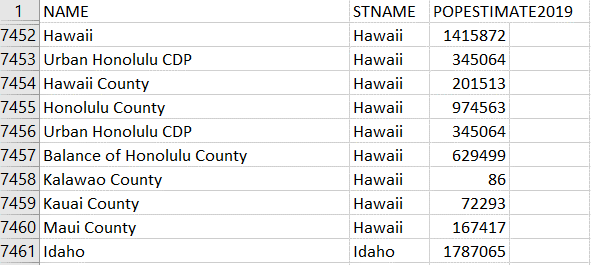
Even after you’ve hand-matched most of the 1166 metro cities across files, there will still be plenty of places where you cannot determine what population Treasury used. For example, see this screenshot of Honolulu’s data, which has two records for the Urban Honolulu CDP (census-designated place) – duplicates perhaps? Plus Honolulu County and Balance of Honolulu County. Having never been to Honolulu, we personally don’t know anything about its local government organization and which of these populations are part of the “metro city.”


Or take Nashville (next screenshot).

Of course, we could do more sleuthing for these two examples – and many others – but ultimately we might not be able to determine the “correct” population – that is, the one Treasury used, in each case.
Treasury has the metro and non-metro populations they used – why not publish them? It shouldn’t require an in-depth understanding of local governments’ structures and Census designations, solid Excel skills, and copious amounts of “free” time to understand how this aid is allocated.
Anyway, now we’ve tried our best to hand-match the list of metro cities to the population file and determine which population to use in ambiguous cases. Next, we need to sum up the populations for all metro cities in each state and subtract that from the total state population. The difference is the non-metro population, the basis for these allocations.
5. How does using the “non-metro population” lead to this distortion?
Take the non-metro populations you calculated and compare them to the NEU populations you summed all the way back in step 2. You’ll readily see that, for some states, the two populations are nearly identical and, for others, they differ by more than 5 million people!
As we explained in Part I and Part II, the difference arises from people living in unincorporated places – which is no one or almost no one in some states but over half the population in others.
6. Wait, what’s an unincorporated place?
We got this question a lot when telling people about this story. An unincorporated place is a place without the equivalent of a town or city government. Everyone resides within a county, but some people reside between the boundaries of other local governments. In fact, about 80 million people, nearly a quarter of the U.S. population, live in such places. And it isn’t just in rural areas like where we both grew up – a large segment of Miami-Dade County is unincorporated. The decision is often related to a preference for fewer government services and lower property taxes.
It is important to note that, neither the Senate nor the House language would disburse funds to people living in unincorporated places through the NEU program.
7. So what would you like to see happen?
Intergovernmental aid allocations must be done using publicly available and reproducible data so all stakeholders have access to the information at the same time and so that the allocations can be understood and confirmed. To that end, we would like Treasury to publish their aid allocation estimates for NEUs or the tools necessary to reliably recreate them. The residents of tens of thousands of communities need to know how much money their community is getting before it’s too late and the money is already spent by insiders.
We don’t think the program’s intention to distribute funds based on how different states’ residents self-organized (or didn’t) into local governments decades ago, so we’d love to see the distortion addressed in some way – by allocating the second tranche of NEU funds in a more equitable manner or encouraging states/NEUs in areas with large unincorporated populations to consider how the NEU aid could be spent in a way that benefits residents of unincorporated places as well.
We don’t know what the options are here but publishing the data should be a minimum.
8. Why does Civilytics care?
Well, this is kind of what we do (not the allocating billions of dollars in aid part, but the part about working with Census data, making public data transparent and public analyses reproducible, and communicating administrative data to stakeholders in an accessible way).
But more importantly, for any program to really give communities a say in how to address their own needs, the information needs to be transparent and accessible. Otherwise, in many communities, political insiders make most of the decisions and other residents find out about the funds too late, if at all. To “build back better” in an equitable way, there must be a targeted effort to inform communities – not just their mayors and town councils but community organizers and the residents who were most affected by the pandemic – about the amount of the money and the rules around that (like we’ve been trying to do at Civilytics). We are thrilled to see some communities holding listening sessions, doing resident surveys, and seeking feedback on how to use funds! But we also know that some communities are just circulating the information and calculations internally, and, by the time community groups hear about the funds, the money will already be, in effect, spent because those who were in the know made the decision long before.
9. Are you anti-ARPA or anti-State and Local Fiscal Recovery Funds?
Absolutely not. We think the program’s goal to “help turn the tide on the pandemic, address its economic fallout, and lay the foundation for a strong and equitable recovery” is laudable. We just want to see the program executed in ways that meet these laudable goals. A small, but crucial detail, is equity in who knows how much money their community is receiving, and how those amounts were calculated. Get that wrong, and a lot of more equitable funding uses are jeopardized.
We think government can and must do better to ensure equitable access to information – especially with billions of dollars on the line.
10. Why are you the only ones who did this analysis?
Probably because we’re the only fools willing to sink several weeks of unpaid work into it. Sigh.
At first, we were just going to produce a tool for communities to look up estimates of their aid allocations. Since we work with advocates and organizers who could use this information to try to influence their local governments’ spending, this was at least adjacent to our funded work. But with each new, incomplete release of information, as we updated our estimates, we found ourselves hooked.
It’s not the machine-learning, neural network, Data Science that attracts investors and HBR covers (we do that type of work too!). It is the kind of careful, detailed data work Civilytics thinks our modern government needs to execute well in order to have a positive impact on an increasingly data-driven world.
PS. Later this summer, partly inspired by these events, we’ll be launching a series of posts about just these kinds of statistics – humble stats – that need to be done well for any other analysis to succeed and which can answer plenty of important questions and drive decisions – like how to give out $19.53B in funding – all on their own.
- *In fact, the federal government does not maintain up to date data on operating local governments and the resident populations they serve. The Census of Governments, a valuable data collection but one that only occurs every five years, is not linked to the population estimates.
- †We use a figure of $178 in our graphs in Part 2 because we prefer to give an estimate closer to the middle since the final amount would depend on how many NEUs are ruled eligible.

