Government agencies, just like any person or organization, resist accountability. As Behn (2001) writes:
“I suspect, however, that the people being held accountable… recognize that, if someone is holding them accountable, two things can happen: When they do something good, nothing happens. But when they screw up, all hell can break loose.”
Accountability can take many forms — but at its most basic it involves checking that the
government’s actions do not constitute a “screw up” in Behn’s words.1 The key point I want to zero in on is the way this form of accountability is seen by agencies themselves — as a no-win game that they do not want to play.
That is why when I first came across the FBI’s statement on the proper use of Uniform Crime Report data I found it so fascinating. In the document titled UCR Statistics and Their Proper Use the FBI describes its policy for how it uses agency-level UCR data:
“Because of concern regarding the proper use of UCR data, the FBI has the following policies:
- The FBI does not analyze, interpret, or publish crime statistics based solely on a single-dimension interagency ranking.
- The FBI does not provide agency-based crime statistics to data users in a ranked format.
- When providing/using agency-oriented statistics, the FBI cautions and, in fact, strongly discourages, data users against using rankings to evaluate locales or the effectiveness of their law enforcement agencies.”
The FBI publishes raw UCR data, but it actively refrains from making department-to-department comparisons. Aggregated data like states or regions are compared in the FBI’s Crime in the U.S. series. But when it comes to making comparisons at the local level — the data upon which these aggregates depend, the FBI draws a line.

This makes sense from a political perspective — the accountability threat is non-existent for the aggregated entities on which the FBI reports. No one is accountable for crime in “Metropolitan Statistical Areas” compared to “Nonmetropolitan Counties.” Reporting these statistics informs the public, but the stakes are not high; in fact, they are almost academic. Even when reporting at the state level it is hard to envision much pressure from the public to lower crime across an entire state since it is well known that crime and policing activity vary greatly within a state, county, and even city (Kent and Carmichael 2014; Stucky 2005; Ward 2016).
So this form of accountability is safe — the FBI can report the data, but politically, the public has relatively little use for it. It’s informative, but inert.
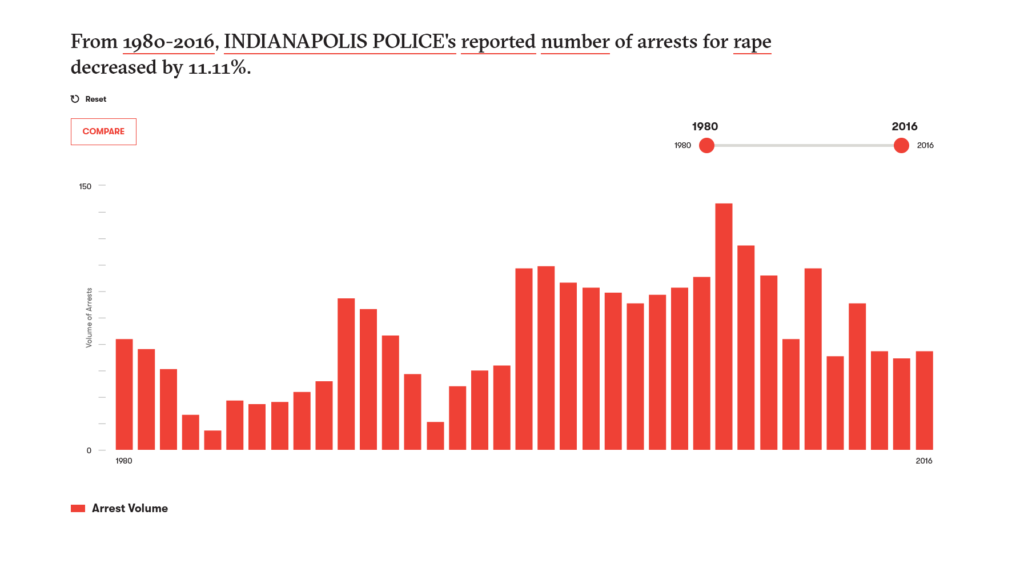
However, the FBI does collect local data and others report it. Here’s an example of the trend in arrests for rape made by the Indianapolis Police department in Indianapolis Indiana.

So why does the Vera Institute (and others) report this information, but the FBI does not?
The FBI provides a list of contextual factors that the UCR does not take into account, which reads a lot like the syllabus to a Sociology of Crime course:
- Population density and degree of urbanization.
- Variations in composition of the population, particularly youth concentration.
- Stability of the population with respect to residents; mobility, commuting patterns, and transient factors.
- Economic conditions, including median income, poverty level, and job availability.
- Modes of transportation and highway systems.
- Cultural factors and educational, recreational, and religious characteristics.
- Family conditions with respect to divorce and family cohesiveness.
- Climate.
- Effective strength of law enforcement agencies.
- Administrative and investigative emphases of law enforcement.
- Policies of other components of the criminal justice system (i.e., prosecutorial, judicial, correctional, and probational).
- Citizens’ attitudes toward crime.
- Crime reporting practices of the citizenry.
This is a thoughtful and pretty comprehensive list of the social determinants of crime rates and the factors contributing to the ability of law enforcement and the criminal justice system to respond to those social determinants. I could do a whole series of posts covering each of those bullets! Maybe I should!
However, almost all of these factors apply to all public services. Let’s take the public service I I am most familiar with — education. You can go down the FBI’s list and you will find each item also contributes to the educational outcomes of schools. Schools are affected by climate, by economic conditions, by transit, by population variation, by family conditions, by urbanization, and by policy, citizen attitudes, administrative practices, and the size of their budgets.
But — we still hold individual school districts and schools accountable. Publicly. Using data. Here for example, you can look up the relative ranking and performance of any school in Kansas. Want to find another state? Just Google the state name and “school report card” and you’ll be on your way.
School systems caveat these report cards. They talk about the factors that aren’t included. They explain the limitations of the data. They do all of this in much the same way as the FBI has done here. But, in the end, the public still has access to both the underlying data and the ranking and analysis of that data to allow for comparison.
Are the comparisons always fair and appropriate? No. Do they account for all these contextual factors? Not always despite sometimes trying. But, have they advanced the public discourse around what education systems should do and whether or not they are meeting those expectations? Absolutely.
So back to the FBI.
The FBI is clearly trying to head off what it sees as an irresponsible use of the UCR — making strong claims about the relative ranking of agencies in preventing or solving crimes. The FBI does not want users to think that UCR data captures the effectiveness of law enforcement agencies. It also does not want the public thinking that the UCR comprehensively describes crime and safety in their local community.
Fair enough.
But this approach — hiding the agency-level data (the politically relevant unit of analysis) and waving our hands, appealing to sociology, that police performance is too difficult to measure is wrong for two reasons.
- Crime, public safety, and law enforcement agency effectiveness should not be held to different standards than other social policy areas like education and public health, where we do enforce local accountability using data. Police should be held to the same standard.
- Avoiding the conversation sets us back as a community. Education has made great strides in the last 25 years in figuring out how to measure different aspects of what schools do and communicate that to the public. It’s not perfect — it’s definitely a work in a progress. But — that work is meaningful and leads to a vibrant civic conversation about public services and the kind of community we want to have.
Further Reading
Behn, Robert D. 2001. Rethinking Democratic Accountability. Washington, D.C: Brookings Institution Press.
Kent, Stephanie L., and Jason T. Carmichael. 2014. “Racial Residential Segregation and Social Control: A Panel Study of the Variation in Police Strength Across U.S Cities, 19802010.” American Journal of Criminal Justice 39 (2): 228–49. https://doi.org/10.1007/s12103-013-9212-8.
Stucky, Thomas D. 2005. “Local Politics and Police Strength.” Justice Quarterly 22 (2): 139–69. https://doi.org/10.1080/07418820500088739.
Ward, Geoff. 2016. “Microclimates of Racial Meaning: Historical Racial Violence and Environmental Impacts.” Wisconsin Law Review 2016 (3): 52.
- There is a lot of work to be done in narrowing down what we mean when we talk about holding law enforcement accountable — but that will be for another post.


