Our previous post on districts reporting zero arrests documented the scale of suspicious zeros in the CRDC: 125 of 376 large districts (those with 20,000 or more students) reported exactly zero school-based arrests in 2021-22, a share that is statistically implausible if the national arrest rate applied uniformly. This post goes further, asking: how many arrests are likely missing from these zero-reporting districts, and what do ten Bayesian models tell us when we zoom in on a single case?
Why ten models? Because we are uncertain about the best way to model arrests using the available data. Each model makes a different choice about how much CRDC history to pool (one recent wave vs. three) and whether to account for referrals to law enforcement, and each is fit two ways — once treating all student groups together, once fitting each group separately. We show all ten rather than pick a winner, because they carefully represent a set of assumptions we can make using the available data and their disagreement and overlap provides useful information about how confident we should be in any single estimate.
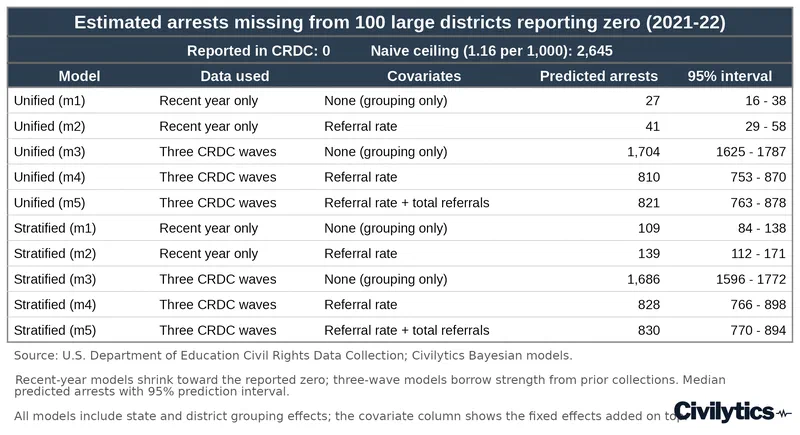
We selected the 100 largest districts that reported zero total arrests. For these districts we calculate a “naïve” expected number of arrests based on the arrest rate per 1,000 students among the 100 districts with the largest student enrollments – 1.15 per 1,000.1 If we assume all of the zeros are misreported and apply this rate to actual enrollment, we would naïvely expect 2,645 arrests across these 100 districts. We know reality lies somewhere between zero and that ceiling. What the models agree on is the floor: across all ten specifications, zero falls outside the 95% prediction interval for every one of these districts – whatever the true count is, it is almost certainly not zero. How far above zero depends on how much history you let the models use (see the table below). If you take prior collection years into account, the models put the missing arrests across these 100 districts at between 753 and 1,787 – well short of the naive 2,645, but a large number unaccounted for. If you look at the current year alone, the count is much lower, between 16 and 171 – but under no model is it zero.
To understand how the models reach this conclusion, we return to the example of Paterson Public School District in New Jersey in detail. Paterson enrolls 18,310 students, making 0 arrests deeply suspicious. Paterson also has a useful historical record: 47 reported arrests in 2015-16, declining to 11 in 2017-18, and then 0 in 2021-22 – a pattern that gives the three-year models something to work with.
Figure 1 shows how each of our ten models compares to the standard frequentist interval. The frequentist interval for Paterson (shown in gray) runs from 0 to 3 – a constant value in the case of no observed arrests. Each panel shows the posterior 95% interval in blue alongside the frequentist benchmark. Model predictions are split into one-year specifications (left panel) and three-year specifications (right panel).
The one-year models – except for stratified model 1 – produce intervals that are narrower than the frequentist interval, demonstrating one of the core advantages of the Bayesian approach: better precision in sparse-data cases. The three-year models tell a different story. Their intervals are all wider than the frequentist interval and their median predicted arrest counts are greater than zero. Models without covariates suggest more than 10 arrests are most likely. The reason is the prior information encoded from 2015-16 and 2017-18: the three-year models remember Paterson’s history and expect it to persist.
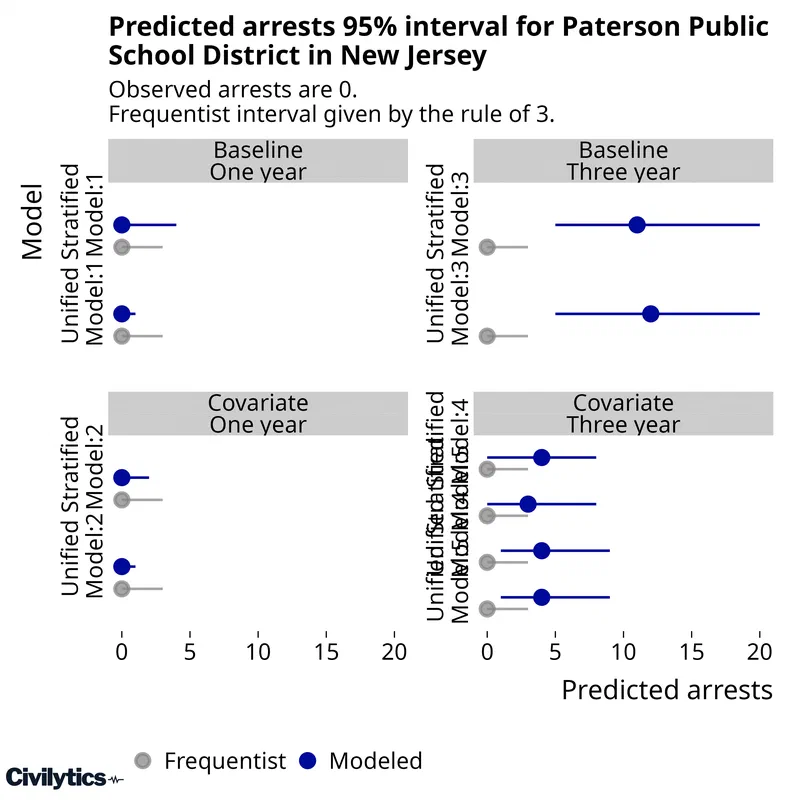
Figure 1 shows point intervals; Figure 2 goes deeper, plotting every draw from the posterior as a histogram for each model. This lets us move beyond “is 0 plausible?” to “exactly how plausible is each arrest count?” For clarity we show only the covariate specification with a level 1 covariate; results with level 1 and level 2 covariates are nearly identical.
The one-year models agree that 0 is the single most likely count for Paterson, but they disagree on how likely. The stratified model (top left of Figure 2) gives 0 arrests only a 50.6% probability, meaning it assigns a near-equal chance to one or more arrests. Adding a covariate brings the stratified model into closer alignment with the unified model, raising the probability of 0 arrests to 71.8%. The unified one-year model is more confident from the start: it puts 0 arrests at 80.4% without a covariate, and the covariate raises this further to 87.6%. Even so, neither one-year model can rule out 1 arrest at 95% confidence – a point we already saw in the wider intervals of Figure 1.
The three-year models are a different matter entirely. Without covariates (top right panel), these models are highly confident that Paterson had more than 0 arrests, but they are uncertain about the exact count: the distribution is relatively flat from 8 to 15, with a substantial tail at 16 or more (arrest counts are top-coded at 16 for visual clarity). These models confidently rule out 0 and cannot confidently rule out as many as 16 missing arrests.
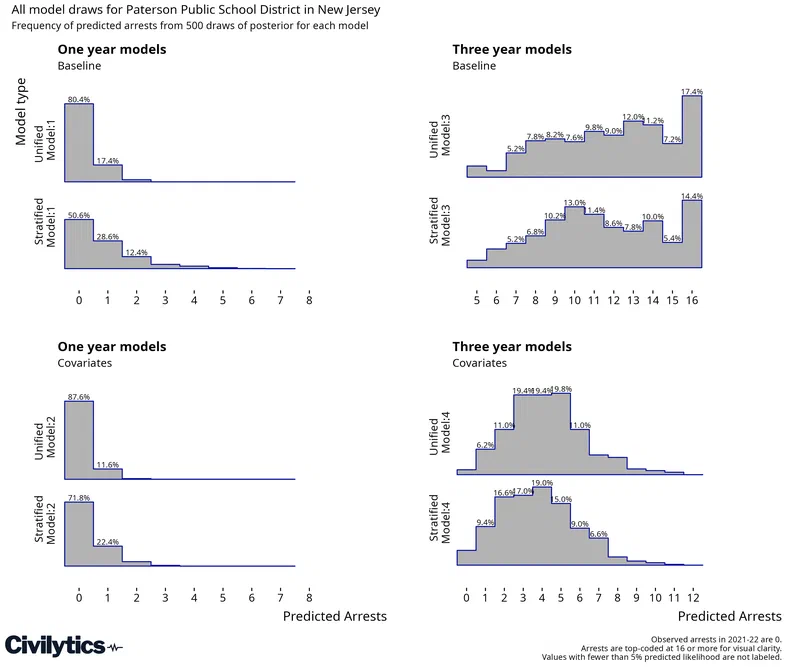
Adding covariates substantially changes the picture for the three-year models. When we tell the model that Paterson reported 0 referrals to law enforcement in 2021-22, the distribution shifts dramatically downward: 3 to 4 arrests become the most likely count, and the models can no longer rule out only 1 missing arrest. Yet even these covariate-adjusted three-year models still rule out 0 arrests with 95% confidence – every draw lands above 0. The referral information pulls the estimate toward zero, but not all the way there.
Taken together, our ten models of arrests offer three interpretive frameworks:
- Strongly align with the reported data and improve precision over the frequentist interval (one-year models 1 and 2): if you believe 2021-22 is the only relevant information, 0 arrests is the most likely outcome.
- Strongly weigh the historic pattern and expect 10 or more arrests (three-year no-covariate models): if you trust the 2015-16 and 2017-18 data, 0 arrests in 2021-22 is essentially impossible.
- Find a middle ground by accounting for referral data (three-year covariate models): the absence of referrals provides genuine evidence that arrests fell, but not necessarily to zero – 3 to 4 arrests remain the most credible estimate.
Bayesian intervals give analysts the tools to choose the framework most appropriate to their application. This flexibility matters especially now: demonstrating the value of CRDC data is particularly important given concerns that the data collection may not continue under the Trump administration.2
This research was supported by a grant from the American Educational Research Association which receives funds for its “AERA Grants Program” from the National Science Foundation under NSF award NSF-DRL #1749275. Opinions reflect those of the author and do not necessarily reflect those AERA or NSF.
We calculate the arrest rate for the 100 largest districts by enrollment, rather than the national average, because the national rate is strongly biased toward zero by the large number of small districts that report no arrests. ↩︎
The 2023-24 CRDC data collection was expected to be completed by summer 2025, with data released in 2026, but there is concern the data may not be prepared and released as planned. ↩︎