Executive Summary
We have released a new way to access the fiscal history of every state, county, city, and township in the country — 47 million rows from the Census Bureau, linked across 56 years, free.
What is it? The full fiscal history of states, counties, and cities linked across 56 years and built on top of the U.S. Census Bureau’s Census of Government Finances data, available as an API and optimized for you or your LLM agent.
Why? Many of the services that most impact our lives are the result of choices made by local governments. And local governments are often more responsive to their residents than the federal government, creating more opportunities to make change. Democratic accountability starts with evaluating those choices.
Where is it? Start at the data page (opens in new tab). The data are available as an API, an interactive data explorer (opens in new tab), or a bulk data download (opens in new tab). R users can install the uscogdata (opens in new tab) package, and I wrote up how it works on my newly rebuilt personal site: uscogdata: 56 years of US local government finance, in one queryable place (opens in new tab).
How can you contribute? Three ways, and we welcome all of them. Use it — we can keep building on this work if it gets used, so a question you answer with the data, or an analysis you pass to a colleague, is itself an argument for continuing the work. Correct it — if you find a number that does not match what your local government reports, tell us; we log every report in a public issue register and credit you. Fund it — this release covers state, county, city, and township governments, and we are actively seeking sponsors to add the remaining 50,000 school and special districts and complete the record.
Want to help? Email us at [email protected] today.
This is the first of three issues on our Census of Governments work. This one covers the data: what we released in September, and what has changed since. The second is my reflection on building it with AI agents and measuring how that went. The third is what comes next, including CoG Chat, a way to ask the data questions in plain language.
Why state and local finances?
State, county, and city governments spend more than $10,000 per person every year. In 2022, they spent $3.4 trillion, more than what the federal government spent on national defense, health, and interest on the debt combined.1 But unlike a single monolithic federal budget made in the remote halls of Congress, these resources are decided on by thousands and thousands of smaller governments in meeting houses and budget hearings throughout the country.
Local governments fund many of the services that touch your life — police, water, roads, parks. Collectively, those choices about what to invest in and when add up to the public services you experience and the built environment you live in. The U.S. Census Bureau has been tracking those choices since 1967. The resulting dataset is one of the most valuable public datasets in the country, but it has been difficult to use for non-experts — the data are spread across 56 years of changing identifiers, item codes, and file layouts.
At Civilytics, with the sponsorship of the Southern Economic Advancement Project (SEAP), we have re-released this data in a more usable form. The U.S. Census of Government Finance API (opens in new tab) and the open dataset underneath it cover revenue, spending, and cash and security holdings for every state, county, municipality, and township the Census Bureau surveyed from FY1967 through FY2024 — 47 million rows spanning 56 published years,2 aligned so that a query for one government returns a continuous series instead of a dozen incompatible versions.3 It is free. It provides inflation-adjustment and per capita adjustments. Every API response carries its own provenance, down to the exact query that produced it.
If you do not write code, the Place Explorer (opens in new tab) answers the same questions in a browser. If you want everything at once, the bulk download (opens in new tab) is CC-BY parquet. If you work in R, the uscogdata (opens in new tab) package reads the same data with one install and no credentials.
Why is Civilytics doing this?
Because we believe in democratic accountability and want to help build the infrastructure to make it happen.
Democratic accountability begins where the public has the most control and the barriers to acting together are lowest. That’s at the local level.
A budget describes how stated priorities meet money. Finance data is how you measure the effort elected officials actually put behind a commitment. You cannot make sense of what a government produced, or what happened to the people it serves, without first knowing what it spent trying.
Years ago, writing about performance accountability, I argued that metrics do not need to be beyond dispute to be valuable — that the discourse around a contested measure is where accountability actually lives, and that debates about what a measure means are debates about who and what counts. I believed it then about graduation rates. I believe it now about the finances of 40,000 governments. This data is not the final word on what any government raises or spends. It is a common, inspectable baseline that makes the argument possible — one where “your number is wrong” can move to a discussion of what counts and why.
This is now a record to which you can contribute — not by changing the evidence, since the Bureau’s numbers stay exactly as filed, but by building annotation and correction on top of it: catching the figures that do not match what you know on the ground, and sharing the work of turning 56 years of filings into something a person can actually read. Done together, that leaves a better account of our fiscal past than any single research team or organization could assemble independently.
An annotation layer, not a replacement
The Census Bureau’s numbers are the foundation and they stay untouched.4 What we have built sits on top of them: a layer that makes the historical record navigable and connects categories and budget concepts across space and time.
That distinction is at the core of our approach. Every consistent series here is the product of thousands of judgment calls — which item codes belong to “Police,” how a category that split in 1988 maps onto its descendants, when a break in a series is real and when it is an artifact of a form change. We think we made those calls well. We also think you should be able to make your own calls, and to measure exactly how your approach differs.
This means the data ships both ways. The Bureau’s reported values are available exactly as filed. Our interpretation is a separate, versioned layer with every rule published — because this interpretation is an analytic choice and you may want to choose differently for your work.
Just one example: 56 years that line up, for whichever governments you pick
Ask for everything the city of Atlanta and Fulton County spent between 1967 and 2024, in 2024 dollars. That is one request, and it returns 2,802 rows covering every category either government reported in every year it responded. Each of the three series below is a single Census account code — police, fire and highways operating expense — held from the first year to the last, so a move in one of them is a move in the spending rather than a change in what was counted.
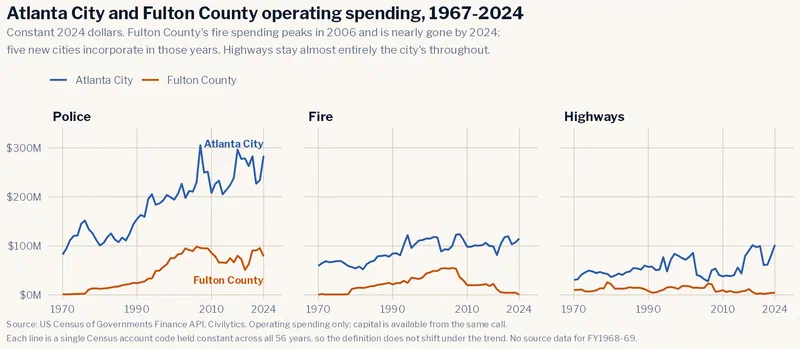
Highways are nearly all city, not county spending. In 2024, Atlanta spent $102 million on them against Fulton County’s $4.2 million, and a similar division has held since 1967. Policing is shared, and the sharing has changed. In 1967 Fulton County spent $4.3 million on police against Atlanta’s $67.5 million; in 2024 it spent $78.7 million against Atlanta’s $283.9 million.5
Fulton County’s fire spending climbs to $54.8 million in 2006 and falls to $300,000 by 2024. The county did not stop putting out fires. Five cities incorporated in north Fulton across those years and each took the service with it — Sandy Springs enters this record in 2006; Johns Creek, Milton and Chattahoochee Hills in 2007; South Fulton in 2019. Put those governments into the same request and most of the money is still there: $53.5 million across the county in 2005, $41.3 million across the county and its new cities in 2022.6
How you verify that this is right
To use data for democratic accountability, even as a baseline, you need some assurance that the trends and totals you see are accurate. We test this data many ways before publishing — reconciling against the Census Bureau’s own published aggregates, cross-checking independent query paths against each other, and fixing or documenting every issue those tests surface. The full account of how we test it (opens in new tab) is public, including what our checks cannot catch, and every issue we have found is listed — included in a public issue register (opens in new tab).
Neither we nor the Census Bureau can verify everything is accurate when compared to your local city budget or Annual Comprehensive Financial Report (ACFR). Tallying dollars is a categorization game, and categories may differ or change. Someone comparing our figure against their own county’s audited financial report will find things no internal process can.
But instead of saying “take it or leave it,” we want to hear from you! If you find a number that does not match what your local government finances are saying, email [email protected] with the government, the year, and a link to what might be wrong. We will log the report in the issue register (opens in new tab) whether or not we can investigate and fix it, and credit you. If we resolve the issue, we’ll describe exactly how in the log.
Over time that shared work will make this version more accurate than the files it was built from — not because the Bureau got anything wrong, but because thousands of people who know their own governments will have looked.
What changed on September 30
Three weeks after release, we rebuilt the data on the Census Bureau’s current files. Eight years, FY2017 to FY2024, had been built from files the Bureau had since replaced: it reissued FY2017 through FY2021 in October 2024 and FY2022 in August 2026, and re-posted FY2023 and FY2024 on August 4, a day after we took our copy. Our check for replaced files was not running, and it was looking for the older years under the wrong file name.
We found the gap by comparing our figures with the Government Finance Database (opens in new tab), which Kawika Pierson, Michael Hand and Fred Thompson maintain at Willamette University. It matched the Bureau’s current files to the dollar where we did not.
National totals barely moved: spending changed by at most 0.5% in any one year. Individual governments moved far more. Chicago’s FY2022 property tax was $1.57 billion in our data and is $3.35 billion in the reissued file. In the Atlanta example above, the city’s FY2019 police operating spending went from $177.1 million to $226.9 million.
A daily check now compares the release stamp inside each Census file with the one we publish, so the next reissue shows up within a day. The same comparison turned up a second gap: fund balances, the money governments hold in sinking funds, bond funds and other funds, now run back to FY1967 instead of starting in FY2012. The Bureau’s files carry none after FY2021.
One change takes money out. The Bureau’s current files for FY2023 and FY2024 carry no sports-betting tax, which its own published estimates for state governments put at $1.93 billion and $2.59 billion. If you work with state tax revenue in those years, our figures are short by those amounts until the Bureau posts files that include it.
Each of these has an entry in the issue register (opens in new tab) — E-012, E-013 and E-014 — with more examples, and what to do if you downloaded FY2023 or FY2024 fund balances before the update. The Southern guide (opens in new tab) has been rebuilt on the new files, and most of its figures moved by less than half a percent. The changelog (opens in new tab) lists every change to the API and the data, newest first.
What happens next
SEAP’s sponsorship allowed us to align and test the state, county, and municipal record — most of the dollars. The next stage is to add the other ~50,000 governments tracked in the Census dataset, including school districts which hold the bulk of the remaining dollars missing from the dataset today.
Our larger ambition is a genuine commons: public issue tracking and user-proposed recipes so that, if you disagree with how a classification was resolved, you can encode and share your alternative equally alongside ours. That stage has a design. It gets built if this stage gets used — and it needs a sponsor. If your organization would rely on infrastructure like this, we want to hear from you.
In the meantime: the guide (opens in new tab) walks through twelve worked analyses, every figure fetched live from the API with the call shown beneath it. The Place Explorer (opens in new tab) allows you to look up any place you like and needs no code at all. And if you want a question answered for your own city or county and do not want to touch the API, send the API link to your friendly local LLM and watch what it can do!
As always, thank you for reading, and please pass this along to someone who’d find it useful.
Jared
Citation, credits, and the formal spec are on the project page (opens in new tab). Data and API: Jared Knowles and Hannah Miller, Civilytics Consulting, 2026. Underlying source: US Census Bureau, Annual Survey of State and Local Government Finances and Census of Governments, Individual Unit Files, FY1967–FY2024. Sponsored by the Southern Economic Advancement Project; interpretations are our own.
2022 is the most recent complete census in the data. See FY2022 federal expenditures here: https://www.usaspending.gov/explorer/budget_function (opens in new tab) The per-person figure divides that $3.4 trillion by the Census Bureau’s 2022 national population estimate of 333.3 million, which you can pull for any year from the national totals tables (opens in new tab). ↩︎
1967 to 2024 is a fifty-eight-year span. The Bureau published no source data for FY1968 or FY1969, so the record holds 56 annual releases. ↩︎
As a detail all governments are surveyed in years ending in 2 and 7, but all states, large counties, and large cities are surveyed every year, as well as a sample of smaller governments to create a statistically representative group in non-census years. The data and exploration layer make this clear to any user. ↩︎
The Census Bureau periodically reissues prior years as new information comes in. A daily check now flags a reissued file within a day, and we rebuild on it; the section on what changed on September 30 below is the first time that happened. ↩︎
These are operating expenses. You can also request capital spending from the same call; it tends to be far more uneven year to year, so it is left out here for clarity. ↩︎
2022 rather than 2024 because 2022 is a census year, when nearly every small city files. Chattahoochee Hills has 3,273 residents and appears in the 2022 record but not the 2024 sample. South Fulton is in both and reports no separate fire line in any year, so the 2022 total covers the county and four of the five cities — you can see which by running the call one government at a time. ↩︎