Why model at all?
School arrests are relatively rare, which makes measuring them precisely challenging: reliable rate estimates require either large student populations or statistical borrowing from related units. Yet each school district’s population is fixed — you cannot simply run more “trials.” This creates a dilemma: for many student groups and many districts, disparities in this rare but consequential school action are statistically invisible.
Fortunately, estimating event rates in fixed population units has a long statistical tradition. The U.S. Census Bureau’s Small Area Income and Poverty Estimates (SAIPE) program is perhaps the best-known example, using model-based methods to produce reliable poverty estimates for counties and school districts too small for direct survey estimates. Public-health researchers have applied the same logic to measure variation in outcomes like obesity and tobacco use across small geographic areas. Bayesian hierarchical models of rare events have been used in domains as varied as oil-spill risk and accidental fishery bycatch. The common thread: borrow statistical strength across units so that even data-sparse units get useful estimates.
Our work applies this tradition to school arrest data from the Civil Rights Data Collection (CRDC). We show that model-based approaches yield more precise arrest-rate estimates than naive rates — precision that enables more meaningful comparisons among districts, between student groups, and across time. Demonstrating the value of these methods matters particularly now, given concerns that the CRDC data collection may not continue to be prepared and released as planned.1
Two ways to read the CRDC. There is a conceptual tension in how to interpret CRDC arrest data. One reading treats the data as a population: the CRDC is designed to be a census of all public schools, so the numbers are what they are — to compare two years, subtract. The other treats the data as a measurement: because nonresponse and reporting errors introduce noise independent of real changes in schools, we need to understand measurement precision before concluding that a change is real rather than artifactual. Our modeling framework is explicitly grounded in the measurement view: we estimate underlying arrest rates and their uncertainty rather than taking reported counts at face value.
Methodological notes. Our models are restricted to schools enrolling students in grade 7 or above; elementary-age students are rarely arrested, and including very young grades would push the model toward structural zeros in uninformative ways. We further restrict to districts enrolling at least 30 students total2 and exclude any district–student-group observation where the group’s enrollment is recorded as zero.
The power of comparison. One of the most striking features of the data is how dramatically nearby districts can differ. Mobile County Schools (AL) reported 139 arrests among the 25,745 students it enrolls in grades 7-12. Jefferson County Schools, which covers much of the Birmingham metropolitan area, reported just 1 arrest among 20,837 students in those same grades. These districts are neighbors in the same state. Are their discipline policies that different? Did one under-report? Did something change between collection cycles? Comparisons like this, or comparisons between a central-city district, a county system, and the charter school sector operating in the same metro area — are among the most actionable analyses the CRDC makes possible, and among the hardest to make when the data are rare, sparse, and noisy.
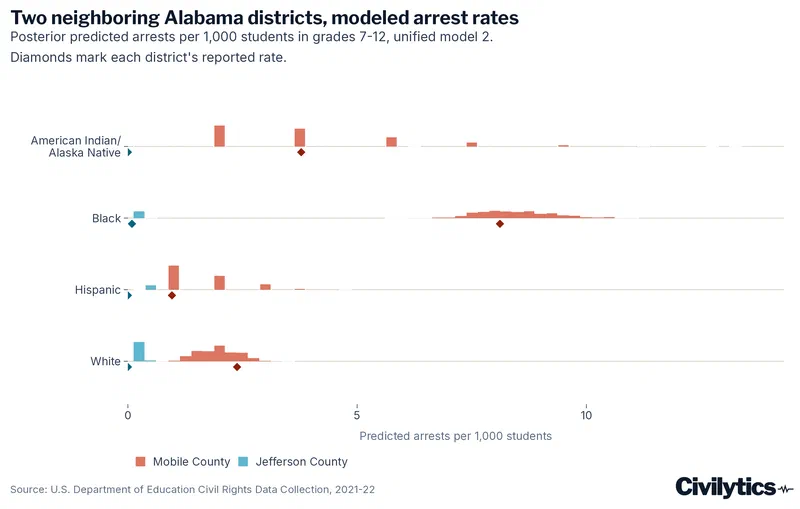
Where we want to take this. We want you to use it! We’ve turned the cleaned data and the estimates from our Bayesian models into a bulk download file and a live public API — you can pull Mobile County’s estimates, the same district from the comparison above, with a single request:
GET https://crdc-api.civilytics.org/api/v1/estimates/0102370?year=21-22&model=unified_m2That returns Mobile County’s modeled arrest-rate estimates — broken out by student group, each with a credible interval — for any of the three collection years and any of the ten models. What we still want to build is the layer that makes this usable for non-programmers: a publicly accessible web application and an AI-assisted interface that let journalists, advocates, researchers, and district leaders query any district, compare neighbors within a metropolitan area, and trace trends across the multiple CRDC collection cycles without writing a line of code.
We want to continue to improve this by expanding this method to additional covariates, disaggregating by student disability, incorporating more prior waves of collections, and continuing to improve the API and interfaces to the data. We want to make it much easier for users to quickly find and compare rates among districts and student groups of interest to them. To that end we are actively seeking funding, collaborators, and users to support this work and help us refine it.
As an example, we have built this demo that allows you to interactively explore the model results for a single school district, so you can explore what the models estimate about Mobile, AL on your own.
Explore Mobile County, AL (opens in new tab)
Finally, this project has helped us learn a lot about how to do reproducible public data analysis and make it extensible and accessible. We already have our second API on the way making US Census of Governments data on government finance much easier to use. Stay tuned and please share our work to help us keep building!
This research was supported by a grant from the American Educational Research Association which receives funds for its “AERA Grants Program” from the National Science Foundation under NSF award NSF-DRL #1749275. Opinions reflect those of the author and do not necessarily reflect those AERA or NSF.