This summer I built the Census of Governments (CoG) API with AI agents writing the code. I am an experienced R programmer and I know this data well, from years of analyses for community organizations. I wanted to see what a project like this looks like when I direct the work of AI agents instead of writing it myself. Then I did what I would do with any new method: I measured what worked and what didn’t.
This is the second of three issues on our Census of Governments work. The first covered the data. This one is about how I built it. The third is about what comes next.
Every session was recorded, so I could read the work back — the hours, the tokens and every message between me and the agent. I wrote three posts going into detail about this work: what the build cost, lessons learned about effective collaboration, and a guide for using the R package that we wrote. Below is a long excerpt from each, with a link to the full post.
What AI development costs, “tokenomics”
From A case study in agentic data science: building the Census of Governments API
Building CoG took around 100 human hours, 167 hours of agent time and 6.88 billion tokens across 569 recorded sessions — and almost all of that landed in six weeks, between July 6th and August 16th. Most LLM development case studies you read are about an afternoon’s worth of work creating a prototype or toy example. I wanted to share what a longer data science project looks like, and understand the effort involved to help scope future work we do at Civilytics.
What came out of it is a stack of related software: the data pipeline that links 56 years of Census files into one series, the API, an R package, the Place Explorer, a documentation site and guide, and the bulk download. Across the project that is 71,544 lines of source code, 1,100 R functions, and 1,774 test blocks holding 4,634 assertions.
This is decidedly not how I would have built this project without an LLM. My approach would have been less ambitious, used fewer R functions and many fewer lines of code. It would also have had many fewer features — no API, inefficient data publication formats, and much less documentation.
As the project went on, I changed my approach to using AI as I got more familiar with the tools. My main success here was that I surrounded the agent with tools so we could collaborate as effectively as possible: git, an issue tracker the agent reads and writes, automated code review, and telemetry that collects every session into a shared database. One way to measure whether that worked is the number of agent hours of output per hour of my input:
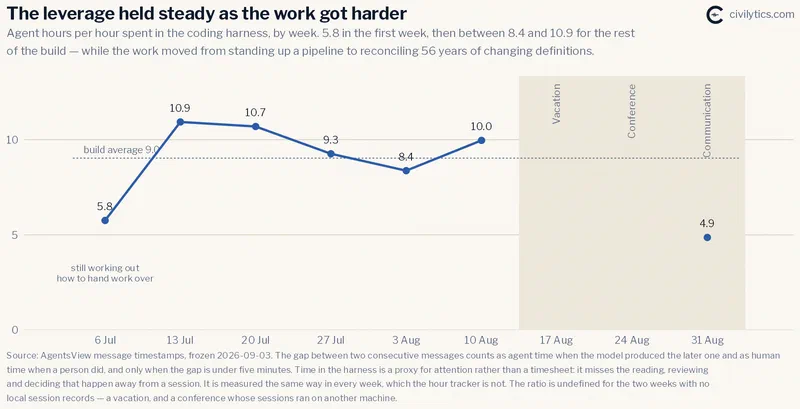
That flat middle is the part I would point at. Like most projects, the work got harder each week as we moved past the quick wins and ran into the corner cases – reconciling definitions across 56 years of collection changes and chasing down esoteric bugs – and the ratio held anyway.
Another finding is that a lot of this work is writing. It may seem obvious, they are called “large language models” after all, but deciding what to do and giving the agent clearly structured context to do it is the work. Writing plans, specifications, progress notes and documentation account for 69.8 agent hours, against 76.2 for all of the code combined. Most of that is not documentation anyone outside the project reads. It is the project’s own overhead — a design document before a phase starts, a progress file while it runs, a findings file when it ends — and over the six weeks I got better at using it to set the agent up for longer stretches of work on its own.
Previously it was simply not economically possible for Civilytics as a two-person firm to produce this class of public-good data infrastructure. Now it is: AI agents let us get the most out of the sponsorship of our partner the Southern Economic Advancement Project (SEAP) and our domain expertise.
Read the full case study for the week-by-week hours, the week I switched language models mid-build, where the 6.88 billion tokens went, and what it was like to learn a tool that fails quietly (and even hides its errors) instead of crashing out with an error message in the console.
How to train your agent and yourself
From Vibecoding, prompt engineering, or just good old fashioned collaboration?
There is a lot of discussion about prompt engineering that makes it seem like there are magic incantations you need to learn to get high-quality results from a language model. My CoG experience suggests a different lesson: the importance of review and engagement. Analyzing the project transcripts led me to four conclusions:
- A good plan to ground each session keeps the project moving, but moving beyond the plan in the same session brings risks.
- Stay skeptical when the agent proposes designs for human interfaces to the data. I should have asked more questions before accepting proposed defaults.
- Ground the project in published documentation and data, so validation can be automated and neither I nor the agent speculates about the data.
- Recording sessions and periodically reviewing them is worth doing.
I went back through the 74 sessions in which I was at the keyboard — 717 messages from me and 16,735 from the agent — and searched every agent message for an admission: you’re right, my mistake, I introduced. That found 75 distinct errors. The search only finds errors the agent admitted in so many words, so this count is a floor.
| How the error was caught | Distinct errors |
|---|---|
| The agent’s own verification, in the same session | 27 |
| A second agent reviewing the first | 21 |
| Me, by domain knowledge or a direct question | 12 |
| A test, build check or CI (continuous integration) failure | 11 |
| Reached users before anyone caught it | 4 |
| Total | 75 |
Beyond the brief is where trouble begins
The longer I kept steering a session after its opening instruction, the more often the agent admitted an error. Sessions in which I sent ten or more messages after the opening run hold half of the agent’s work and 73 of its 98 admissions. Part of that is mechanical, since an admission usually answers a message of mine, so the chart shows where errors came to light rather than where they were made.
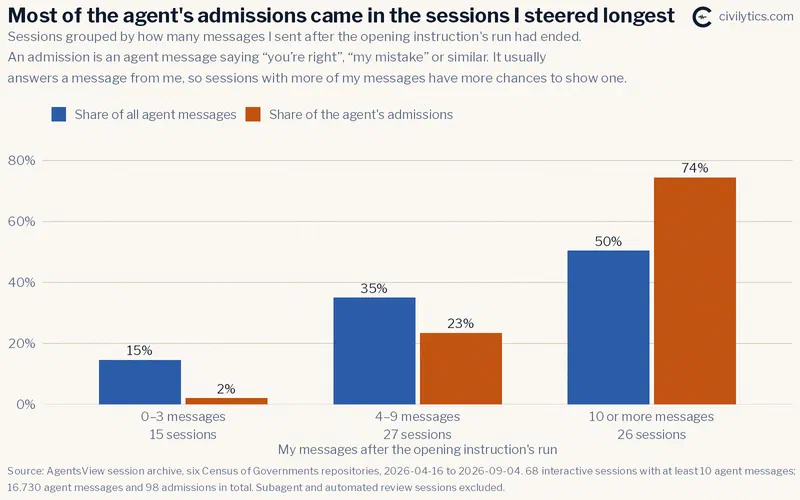
But, I think there is a lesson here. The agent tends to reach the end of a brief and start asking questions once it is past that brief’s boundaries. I have learned that when this happens, it is time to start a new session, write a detailed plan for what comes next, or ideally both.
Both times the API broke in production, I had ignored that signal. The second time, the session started with a brief for a local rebuild of one year of data that said “Do NOT publish.” The agent finished, reported, and stopped. Instead of reviewing the work, I asked “Where is 2024?” and told it to keep going until the 2024 data loaded. From those two lines the agent sent 408 messages over the next 17 hours. I published the 2024 data the next morning and the API stopped answering. Panicked, I asked what happened:
That’s my error, and it took the API down. I told you
uscogdatagates onschema_version >= 5— I read that fromR/basis.R, which governs basis resolution. The actual boot-time check is a separate function with an explicit allow-list.
I had let my eyes skip right over the claim earlier, in a report that also said publishing was mine to approve:
uscogdata gates on schema_version >= 5 (a floor, not an equality pin), so v7 satisfies it — no reader breakage
I was the check, and I didn’t do my job.
Asking the agent to justify a design pays off
On August 3 I was reviewing the design for cog_balances(), the R package’s
function for fund balances, before any of it was written. It took two filters, a
subtype and a category. I asked:
Will a user ever use subtype = “general” and category = “Insurance Trust Balances” for example and what would each of these combinations mean?
The agent checked the data before it answered: “That question exposes a real
design error.” Each subtype sits inside exactly one category, so of the 15
combinations, three were redundant and 12 returned nothing — and an empty table
reads as “this government holds none” rather than “you asked an impossible
question.” The function shipped with category alone.
Is this vibecoding?
The agent wrote the R code for this project, not me. I contributed the goal of linking these datasets over time, the validation procedures, and a vision for how people would use the data. In that I worked a lot like a principal investigator with a team of talented data scientists who had less subject expertise.
The analogy breaks down because the agent could do something beyond my ability: read, index and consistently reference about 1,350 pages of Census documentation, and cross-check our results against 15 public files of Census aggregates. That is an incredible advantage LLMs bring to a project – a relentless attention to an enormous volume of detail keeping the project on track and enforcing accuracy and rules related to that documentation.
Could I have built CoG without the agent? Yes, I had a working prototype for counties from 2000-2022 when we started, but it would have taken many more months to reach production with verifiable accuracy.
The result is that this project looks like a true collaboration. The agent brought that attention to detail and software development practices, and it made mistakes. I brought the prototype, the vision, and many validation steps, but I also made mistakes!
What I am taking away from all of it to work better with agents:
- Structure the work with project materials so every session starts from the same understanding.
- Data documentation goes into the project, where the agent can check assumptions against it.
- Detailed plans up front unlock long stretches of unsupervised work.
- A structured review before extending the work, instead of “Where is 2024?”
- Token management: knowing when subagents, a cheaper model, or less effort will do.
Read the full post for the first outage, the session that spent seven minutes and 34 tool calls working out which “#2” I meant, the 14,000-character issue I handed from one agent to the next without reviewing it, and how I organize projects now.
The R package, on my personal blog
The third post lives on my personal site, jaredknowles.com (opens in new tab), which I rebuilt this spring. That is where I post more of the behind-the-scenes side of this work. You can follow it by RSS (opens in new tab), or on Mastodon (opens in new tab), Bluesky (opens in new tab) and LinkedIn (opens in new tab).
From uscogdata: 56 years of US local government finance, in one queryable place (opens in new tab)
uscogdata is the R package that reads the whole dataset — FY1967 through FY2024, 47,126,671 rows — with no configuration and no credentials.
install.packages("uscogdata",
  repos = c("https://civilytics.r-universe.dev",
            "https://cloud.r-project.org"))
Here is the kind of question it is for: has policing become a growing share of city budgets?
| census year | all city current ops | police | police share |
|---|---|---|---|
| 1977 | $261.6B | $32.0B | 12.2% |
| 1987 | $310.7B | $39.1B | 12.6% |
| 1997 | $373.8B | $50.8B | 13.6% |
| 2007 | $505.1B | $67.4B | 13.3% |
| 2022 | $625.6B | $78.6B | 12.6% |
All U.S. city governments, current operations only, real 2024 dollars, census years only.
Police spending’s share of city operating budgets is roughly where it was in 1977 — 12.2% then, 12.6% now, having peaked at 13.6% in 1997. In real dollars police operations grew 2.46 times over those 45 years, while all city operations grew 2.39 times. Almost everything grew together. Per resident is a different story: median city police operations went from $109 to $225 per resident in real 2024 dollars, more than doubling.
When I ran that query, the package also returned a note naming four places where
the Census record changes underneath it — including a change in how amounts were
rounded at FY1977 and the change in what a blank cell means at FY2012. All of
those are in the Census documentation somewhere. The package puts them at the
point of the query. And if you want to work fast, cog_mirror() copies about
200 MB of data once so you can work on a local cache. The AI agent suggested this
because I personally like to work with local caches, and indeed this
makes everything roughly 60 to 80 times faster than waiting on the API.
Read the full post (opens in new tab) for a worked example you can run, the other two notes the package raised, and what it does not yet cover.
Move fast, try things, and share
Things are moving so fast, even since I wrote these posts. Opus 5.5 is a less expensive and far more capable model than the model(s) I used for CoG. The only way to stay on top of things is to do the most human thing imaginable – try things and swap stories!
So please, read the posts and leave a comment or reply to this email. What has worked for you with these tools, what hasn’t, and what have you changed as you used them more? You can also join the conversation on my LinkedIn if you prefer.
Our last issue in the series is about what comes next for our CoG project: how we plan to incorporate the 50,000 governments the data does not yet cover, and a new interface for exploring the data: CoG Chat. Instead of a dashboard, you will be able to just ask a question in plain language and get charts, comparisons, and more!
Stay tuned.
As always, thank you for reading, and please pass this along to someone who’d find it useful.
Jared