The American Rescue Plan Act’s (ARPA) State and Local Fiscal Recovery Fund (SLFRF) Program provide a huge influx of funds to cities, counties, and states. Understanding where the money is going can be challenging, but several groups have put together excellent spending trackers to help.
These trackers are great resources to learn how your city, county, and state are spending their ARPA funds. The trackers are also helpful to discover which local governments are using ARPA money for issues you care about, like affordable housing, violence prevention, or guaranteed income programs.
Below we highlight four trackers, providing some need-to-know information about each. Is there a useful tracker we missed? If so, please send it our way — we’d love to know about it!
Why are multiple trackers necessary?
Because the SLFRF funds went to 50 states, around 3,000 counties, and about 20,000 cities, towns, and villages. That’s a lot to keep track of!
Different groups are tracking spending by different levels of government, in different categories, and at different levels of detail.
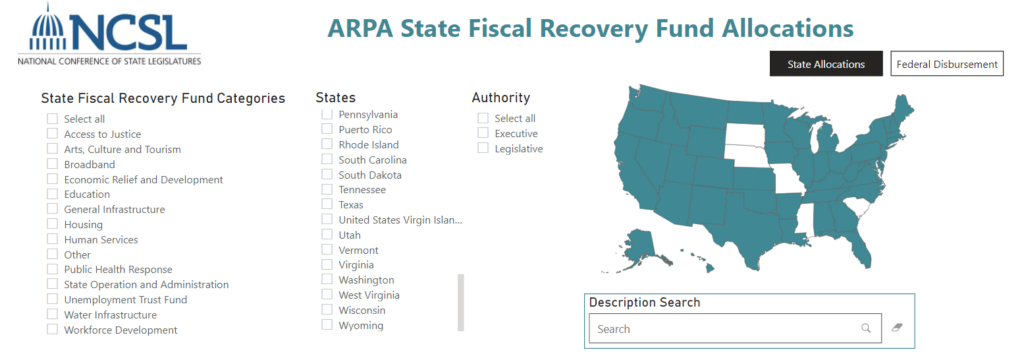
Up first, a state-focused tracker from the National Conference of State Legislatures.
1. NCSL Provides the Only State-Focused Tracker

Key features of this tracker from the National Conference of State Legislatures (NCSL):
- Includes data for all but 5 states
- Updated very frequently — last time we checked, it had been updated only 3 days earlier
- Allows users to examine spending by category and by searching for specific words
- Links to specific text (press release, legislation, etc.) so users can learn more
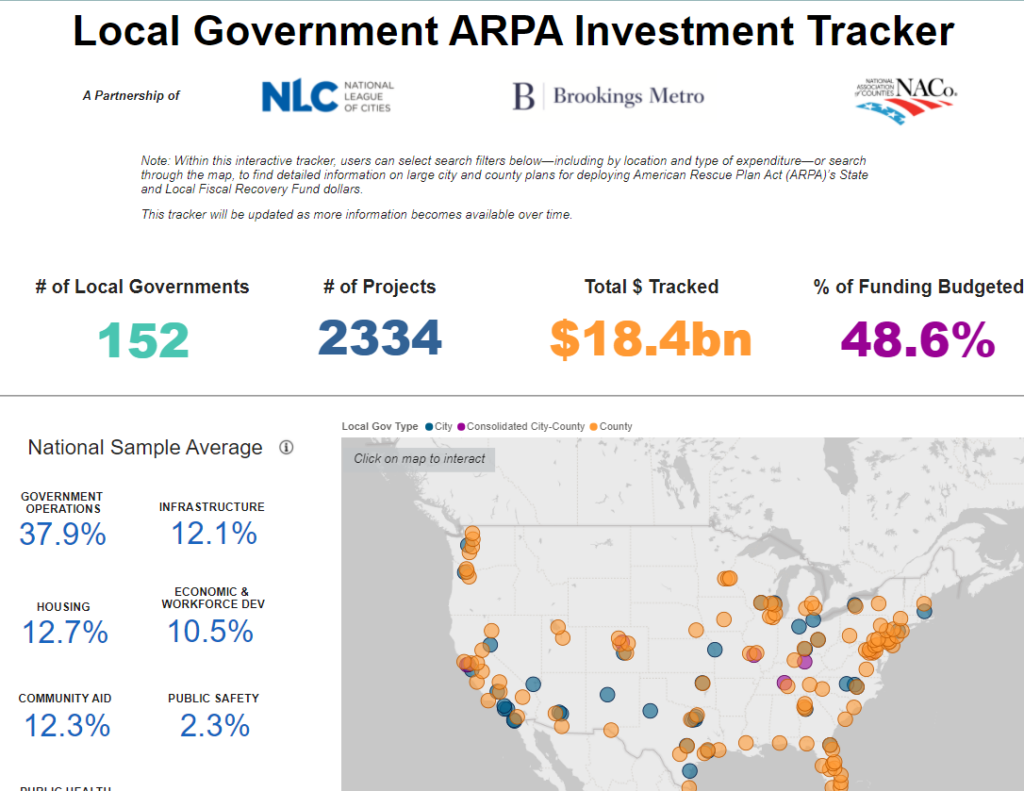
2. NLC/NACo Tracker Includes 152 Cities & Counties
Key features of this tracker from the National League of Cities (NLC), National Association of Counties (NACo), and Brookings Metro:
- Allows users to filter to cities, counties, or consolidated city-counties (like St. Louis and DC)
- Allows users to focus on specific spending categories, such as economic and workforce development or public safety
- Breaks out spending amounts so users can focus on the largest investments or investments over a certain $ threshold
- Includes fairly in-depth project overviews so users get a better sense of what each allocation actually means without having to do their own research as well
One limitation of this tracker is that it doesn’t include links to the original sources; if users want to learn more about a specific project or allocation, they will need to search outside the tracker. Another limitation is that it’s not clear how frequently the tracker is updated, though the website does say the tracker will be updated as more information is available.
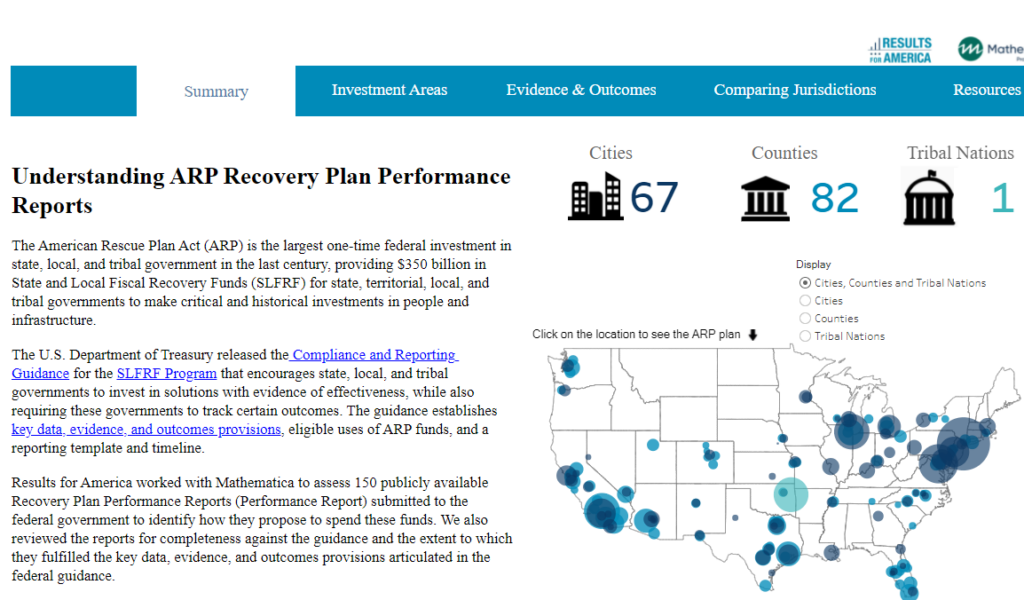
3. Results for America Tracker Includes 149 Cities & Counties
Key features of this tracker from Results for America and Mathematica:
- Links users directly to each location’s ARPA plan
- Allows users to focus on specific spending categories, including some more detailed categories not highlighted by the trackers above, such as Guaranteed Basic Income, Emergency Rental Assistance, and Pilot Programs
- Includes information beyond allocation amounts and spending categories by highlighting which plans clearly invest in engaging communities, conducting evaluations, and/or ensuring equitable outcomes
One limitation is that the dashboard is entirely focused on the Recovery Plan Performance Reports submitted by August 31, 2021. It is not clear if the dashboard will be updated with more recent data.
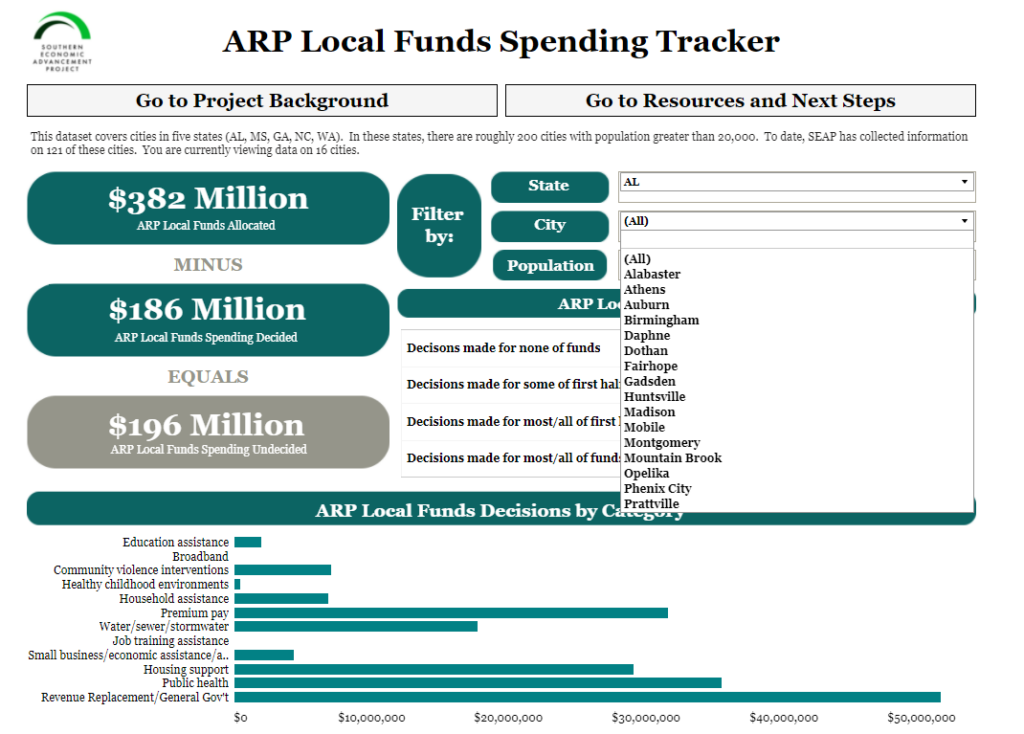
4. SEAP’s Tracker Goes Deep on 5 States
This final tracker goes deep rather than broad, focusing on 5 states but aiming to include all cities with at least 20,000 residents. Key features of this tracker from the Southern Economic Advancement Project (SEAP):
- Covers 5 states: Alabama, Georgia, Mississippi, North Carolina, and Washington
- Allows users to filter by state and city
- Has a useful focus on government decision-making, highlighting whether decisions been made for none of the funds, the first half of funds, most/all of the funds, etc.
- Rates whether each local government sought any public engagement in ARPA spending process and/or included an equity component in their ARPA plan
One limitation of this tracker is that users can’t filter by spending category or search for cities that are using funds in a particular way, such as for premium pay or healthy childhood environments.
Know of Another Tracker?
Please share it with us! If there is another tracker you have seen, we would love to know about it. Please reach out. We’re trying to get the word out about useful trackers (and how cities are using their funds) on social media — please follow us there!
Want to Learn More?
We’ve written a lot about ARPA, including a summary of what you should know about the final funding rules and ideas for how to use funds (plus even more ideas). Check out all of our ARPA coverage here: https://www.civilytics.com/public-finance/slfrp/


