The British medical journal The Lancet recently published “Fatal police violence by race and state in the USA, 1980–2019: a network meta-regression.”
The tl;dr
There is no official record of people killed by police in the U.S. (though there is an official record of deaths of law enforcement officers). A new study finds that official government death records did not correctly report over 50% (55.5%) of all deaths attributable to police violence. Over 30,000 people died from police violence in the last 40 years (1980-2018) but less than half of those deaths were officially attributed to police.
To determine this, the researchers compared data from the National Vital Statistics System (NVSS), which contains all death certificates in the U.S., to data from three non-governmental open-source databases on police violence: Fatal Encounters, Mapping Police Violence, and The Counted. This was done to measure the degree of underreporting of police violence in the NVSS – the official record of deaths in the U.S.
Why This Study Is Important
This is a landmark study of state violence – and underreporting of state violence – in the U.S. The study:
- sheds light on how the lack of official statistics on police violence allows police killings to be underreported
- documents how this underreporting varies across states and by characteristics of those killed
- provides some insight into why such underreporting occurs (due to decisions by county medical examiners, some shaped by political pressure, and decisions about data collection methods).
At Civilytics we strive to put social science in the hands of the public to make change. In that spirit, this is the first in a series of posts highlighting important social science research and explaining our take on how this research should shape the way we think about our communities and government.
Police killings of civilians are state violence. State violence means violence carried out by our government, which represents us, the public. In many countries, police killing civilians is almost unheard of but, in the U.S., police kill civilians every day. State violence should be heavily regulated, strongly controlled, and carefully reviewed. This is not the case in the U.S.
Police killings do not just represent individual tragedies (though they are). Police killings are also collective moral choices. How we identify, investigate, measure, and review them is a measure of our values. In the U.S., the public has no official accounting of how many people in our country, state, county, or city have been killed by the police. The U.S. does maintain official statistics on all deaths, including the “cause of death,” and these statistics are sometimes used to estimate how many people are killed by police (just as they’re used to estimate how many people die of heart disease, breast cancer, etc.).
This study shows that official cause of death determinations underreport by half how many people are killed by the police. This underreporting may, in many cases, be called a statistical cover-up.
We cannot reckon with the pervasiveness of police violence in the U.S. until we honestly confront it. This paper provides an important, accurate accounting of the lives lost to police violence.
Study Findings
The study found that rates of underreporting deaths due to police violence vary greatly across states. The 5 states with the highest underreporting rates were:
- Oklahoma: 83.7%
- Wyoming: 79.1%
- Alabama: 76.9%
- Louisiana: 75.7%
- Nebraska: 72.9%
In these states, more than 7 or 8 out of 10 deaths caused by police were miscategorized as having no police involvement. Put another way, for every 3 deaths correctly attributed to police, another 7 or more were misattributed to something else.
The five states with the lowest underreporting rates were:
- Maryland: 16.4%
- Utah: 19.8%
- New Mexico: 26.4%
- Massachusetts: 32.5%
- Oregon: 36.3%
Even in the “best case” states, police killings are underreported. However, “statistical coverups” of state-inflicted deaths are occurring much more frequently in some states than others.
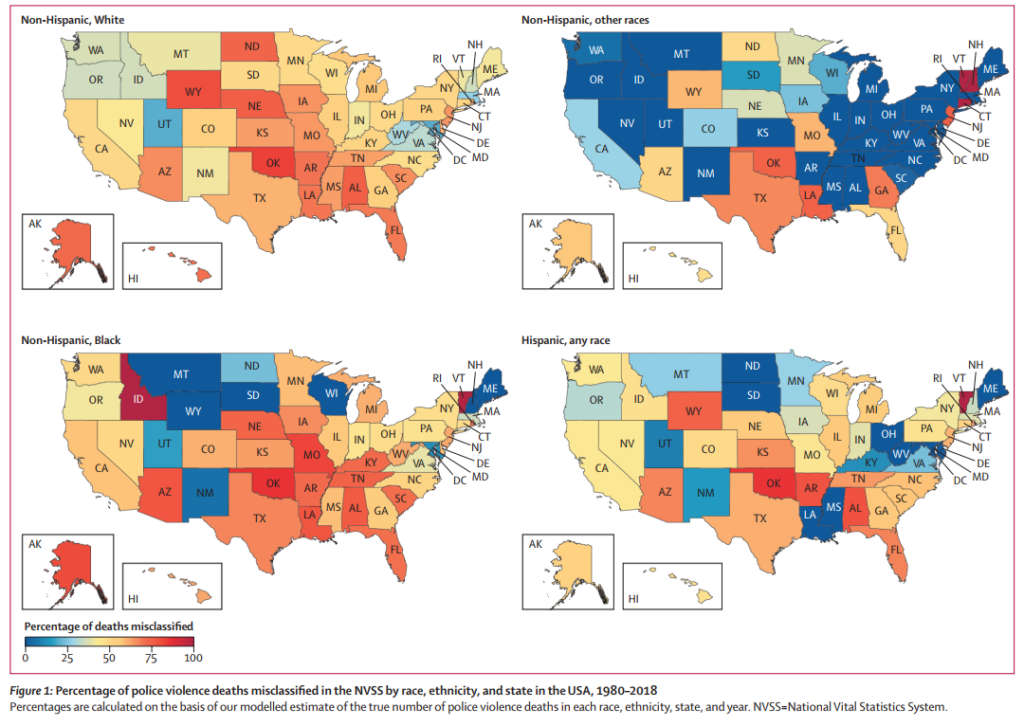
Rates of underreporting also varied significantly by the victims’ race/ethnicity. The greatest underreporting of deaths was for Black, non-Hispanic people. 59.5% of their deaths due to police violence were misreported. However, rates were above 50% for White, non-Hispanic people too.
Figure 1 copied below from the article shows the percentage of police violence deaths that were misclassified. Warmer colors indicate a higher percentage of misclassified deaths. For example, in Wyoming, around 75% of White non-Hispanic deaths due to police violence were classified as due to another cause.*

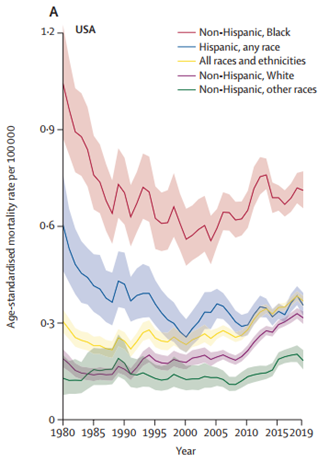
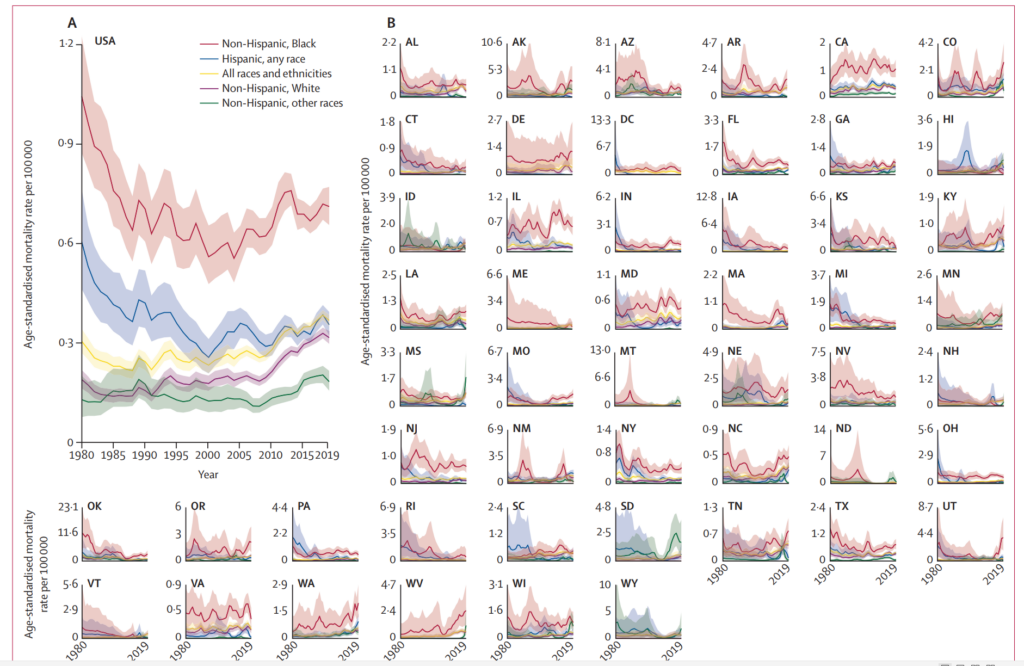
The study also shows that deaths due to police violence declined for most groups of people from 1980 to 1990 but have remained relatively constant since then. This is illustrated by the graph below, excerpted from Figure 4 in the article, which shows mortality rates due to police violence for different racial/ethnic groups over time.

Evidence suggests that there have been some successful reforms to reduce police violence from 1970 to 1985; 50 cities with populations larger than 250000 residents halved their fatal police violence from 353 to 172 per year, primarily through banning shooting of non-violent fleeing suspects….However, … body cameras, implicit bias training, de-escalation, and diversifying police forces have all failed to further meaningfully reduce police violence rates….[F]atal police violence rates and the large racial disparities in fatal police violence have remained largely unchanged or have increased since 1990. (p. 1251)
The study also describes some other patterns that have been well-documented elsewhere but are clearly illustrated in these data as well. For example, the authors report that:
- The rate of police killings for non-Hispanic Black people is about 3.5 times higher than the rate for non-Hispanic White people.
- The rate of police killings for Hispanic people is about 1.8 times higher than the rate for non-Hispanic White people.
- For men of all race/ethnicities, deaths due to police violence are highest for those ages 20-50, and particularly for those ages 20-35.
- 95% of people killed by police are men.
Study’s Conclusion
The study concludes with a very powerful paragraph stating:
Although it might seem drastic to many in the USA to defund, disarm, or abolish militarized police, there are many places where living without militarised police is already a reality. 19 nations, including Norway and the UK, do not arm their police officers or only arm select officers. The difference these practices have on loss of life is staggering: no one died from police violence in Norway in 2019, and three people were recorded to have died in England and Wales from police violence between 2018 and 2019. To respond to this public health crisis, the USA must replace militarised policing with evidenced-based support for communities, prioritise the safety of the public, and value Black lives. (p. 1252)
Three Implications
This is a study with a lot of important implications and takeaways. Here are some of ours:
1. The paper points out that there is a government data collection effort, the National Violent Death Reporting System (NVDRS), that would be better than the National Vital Statistics System in trying to account for all deaths due to police violence. However, not all states are participating in it. Some states started participating in the NVDRS as early as 2003 but others are still not participating. And, importantly, the NVDRS does not seem to have very good coverage of non-firearm police killings.
There are lots of ways forward within the government data systems, such as pushing all states to participate in the NVDRS, including a checkbox for police involvement on death certificates rather than relying on mention of it in a text field, and establishing the independence of forensic pathologists from law enforcement.
We are big fans of open-source data and analysis but our moral value should also be that the state accurately report how many people are killed by state agents each year. Obviously nongovernmental data has been crucial for exposing the extent to which these deaths are underreported, but we need to push for state data systems – not just volunteers – to accurately track these incidents.
2. Without accurately documenting how often people are killed by police, we can’t understand if any police reforms work. This is also why, in policy evaluations, the biggest “negative externality” of policing – civilian deaths – is unaccounted for in almost all studies of “police effectiveness.” Better data, better studies.
There’s been a lot of media coverage of this study and this has been one of the takeaways highlighted in most of the stories. (Most of the stories we’ve read talked to the same sources and had the same things to say so we haven’t found any story particularly useful. However, for a selection of coverage, here are gift links from The Washington Post and New York Times. And this Bloomberg City Lab article was also perhaps better than average.)
3. An interesting extension of the paper could look at underreporting of deaths due to police in specific counties and cities. The study shows that there’s variation across states in the degree to which medical examiners’ rulings deny police involvement in deaths. This also undoubtedly varies by county too, and it could be useful to use the data and methods from this study to estimate the number of underreported police killings in specific counties and cities over time. We can all hold our local officials (coroners, medical examiners, and police and court officials) accountable for being accurate and honest and let them know that this information matters.
Data Details
For those interested, here are some key points to understand about the data sources used in the study:
- Death certificates (including cause of death) are filled out by a medical examiner or coroner for homicides and cases of suspected “foul play.” Although systems like NVSS “are considered to be reliable sources on causes of death, they present a potential conflict of interest for deaths from police violence, since the same state responsible for violence is also responsible for reporting it” (p. 1240).
- Regarding the 3 non-governmental data sources: Mapping Police Violence tracks police killings from 2013-present. The Counted, a project of The Guardian newspaper, tracked people killed by police and other law enforcement agencies in 2015 and 2016. Fatal Encounters covers a longer timeframe (2005 – present) but includes all people killed during encounters with the police.
- The researchers excluded 22% of deaths in the Fatal Encounters dataset, explaining: “we assumed that any death in FE with cause listed as ‘Vehicle,’ ‘Drug overdose,’ ‘Undetermined,’ ‘Medical emergency,’ ‘Other,’ or ‘Unknown’ would be less likely to involve direct violence perpetrated by the police, and therefore excluded them. […] A major limitation of this assumption is that in cases where there are no eyewitnesses, even the open-source methodology relies on police and autopsy reports, which incorrectly over-emphasise the role of drugs and medical emergencies through medically contested conditions like “excited delirium,” which may be rooted in racial stereotypes.” (Appendix p. 6).
- The authors also acknowledge that deaths involving Tasers, asphyxiation, and other non-firearm mechanisms are heavily contested, with police statements and autopsy reports sometimes claiming that drug use and medical conditions are responsible for death. This likely leads to some undercounting of deaths due to police violence across all four data sources included in the study.
- *According to the study, previous research has found that, for police violence deaths that are misclassified, the most common coded cause of death is civilian assault.


